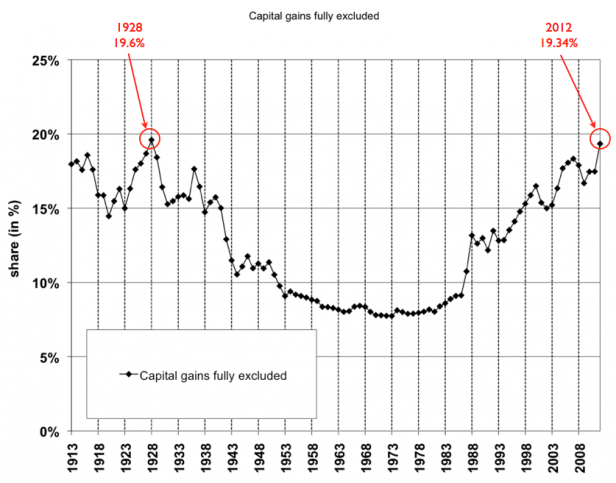
Per Mike Konczal of Rortybomb, writing over at Next New Deal: In 2012, the Top 1% (notwithstanding capital gains, which only slightly changes the picture) took home the largest share of the national income since 1928. Socialism!
Haunting the Web Since 1999

Per Mike Konczal of Rortybomb, writing over at Next New Deal: In 2012, the Top 1% (notwithstanding capital gains, which only slightly changes the picture) took home the largest share of the national income since 1928. Socialism!
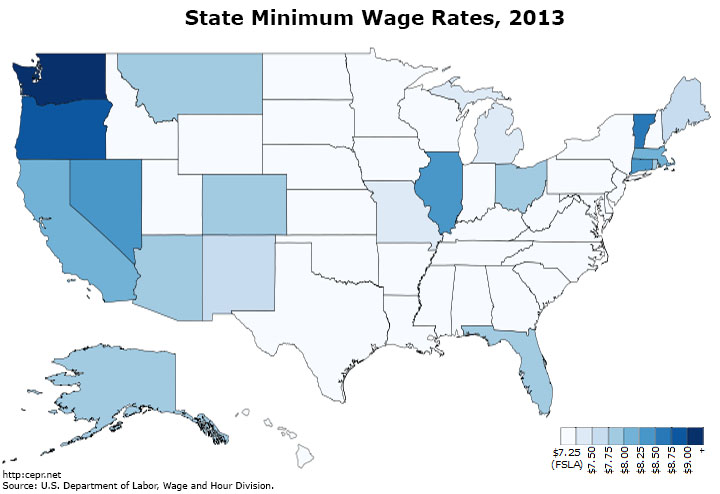
After four years of inaction, CEPR examines the costs of a stagnant minimum wage. Conversely, raising the minimum to $10.10 an hour — as supported by 80% of Americans — would create an estimated 300,000 jobs and add $33 billion to the economy. So you’d think Congress would get on that, yes? Umm…
In very related news, a new AP poll finds that, as a result of stagnant wages, income inequality, and a deteriorating job market, fully 80% of Americans experience poverty, unemployment, and deprivation at some point in their lives. “By 2030, based on the current trend of widening income inequality, close to 85 percent of all working-age adults in the U.S. will experience bouts of economic insecurity.” The American Dream, now with Vegas casino odds.
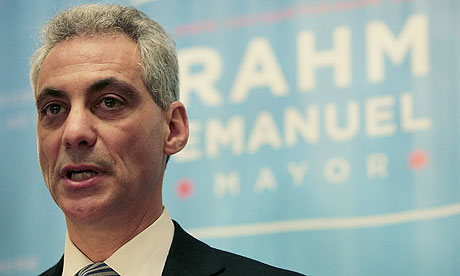
Yet another exhibit in the general brokenness of today’s Democratic Party [See also: RepubliDems, Dems without Spines]: By way of Quiddity, Chicago mayor, former Obama consigliere, and one of the Village’s favorite High Democratic muckety-mucks Rahm Emanuel — who apparently was pulling a 19% approval rating in February — tries to offset school and health center closings in his city with a giant new arena for a sub-par basketball team. (Apologies in advance for the unwieldy, shoehorned-in Angry Birds analogy in the Nation piece.)
“The only explanation for this is that Rahm is scratching someone’s back in the DePaul Catholic hierarchy of Chicago…In this case, the hottest rumor is that approval of legalized gambling is on the horizon and the convention center’s locale will be its epicenter. The arena is, in effect, a Trojan Horse for a casino.”
As I’ve said several times before about this sort of shameful behavior — and Rahm is a frequent offender in this regard — if we Democrats are just going to act like Republicans, voters might as well pull the lever for the real thing.
In very related news, the Dow reaches a new high — 14,164 — even as household income hits a decade low. “As a percentage of national income, corporate profits stood at 14.2 percent in the third quarter of 2012, the largest share at any time since 1950, while the portion of income that went to employees was 61.7 percent, near its lowest point since 1966.”
“In the 2010 election cycle, 26,783 individuals (or slightly less than one in ten thousand Americans) each contributed more than $10,000 to federal political campaigns. Combined, these donors spent $774 million. That’s 24.3% of the total from individuals to politicians, parties, PACs, and independent expenditure groups. Together, they would fill only two-thirds of the 41,222 seats at Nationals Park.“
According to a recent report by the Sunlight Foundation, 0.1% of the country made almost a quarter of the campaign donations last year. It’s a great system, tho’.
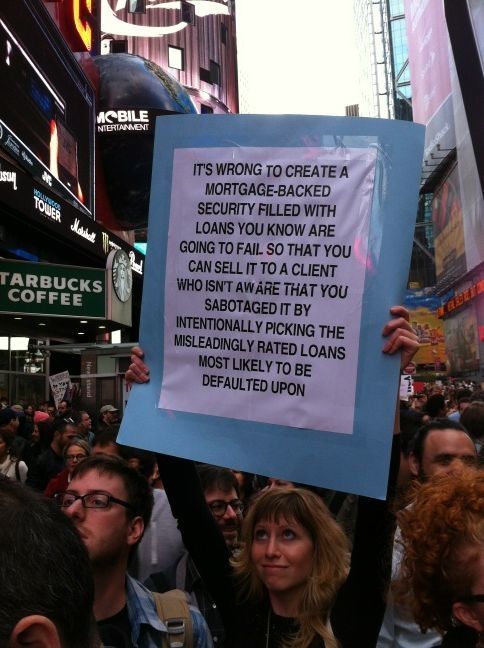
For the benefit of the willfully dense — i.e. all the telegenic denizens of the Village — Slate‘s Dahlia Lithwick explains the basic meaning behind Occupy Wall Street: “They are holding up signs that are perfectly and intrinsically clear: They want accountability for the banks that took their money, they want to end corporate control of government. They want their jobs back. They would like to feed their children. They want–wait, no, we want– to be heard by a media that has devoted four mind-numbing years to channeling and interpreting every word uttered by a member of the Palin family while ignoring the voices of everyone else.“

A brand-spankin’ new CBO report concludes what we all already know: Income inequality has surged since 1981, and government, post-Reagan, has consistently failed to address the problem. “‘The equalizing effect of federal taxes was smaller’ in 2007 than in 1979, as ‘the composition of federal revenues shifted away from progressive income taxes to less-progressive payroll taxes,’ the budget office said.” But, hey, let’s sweat that deficit.
“The contrast in fortunes between those on top of the economic heap and those buried in the rubble couldn’t be starker. The 10 biggest banks now control more than three-quarters of the country’s banking assets. Profits have bounced back, while compensation at publicly traded Wall Street firms hit a record $135 billion in 2010. Meanwhile, more than 24 million Americans are out of work or can’t find full-time work, and nearly $9 trillion in household wealth has vanished. There seems to be no correlation between who drove the crisis and who is paying the price.“
As Bank of America pays a pittance to other banks for its malfeasance, former chair of the Financial Crisis Inquiry Commission Phil Angelides looks into how the winners are now rewriting the history of the 2008 financial collapse. “So, how do you revise the historical narrative when the evidence of what led to economic catastrophe is so overwhelming and the events at issue so recent? You and your political allies just do it. And you bet on the old axiom that a lie is halfway around the world before the truth can tie its shoes.” Attorney General Schneiderman, our nation turns its lowly eyes to you.
It used to be a central tenet of progressivism was working to shorten the work week. Now, even unemployment-soothing innovations like workshare go nowhere, and, as Mother Jones‘s Monika Bauerlein and Claira Jeffrey explain (with handy graphs), we are all victims of the Great Speedup…but not the beneficiaries. “For 90 percent of American workers, incomes have stagnated or fallen for the past three decades, while they’ve ballooned at the top, and exploded at the very tippy-top…In other words, all that extra work you’ve taken on — the late nights, the skipped lunch hours, the missed soccer games — paid off. For them.”
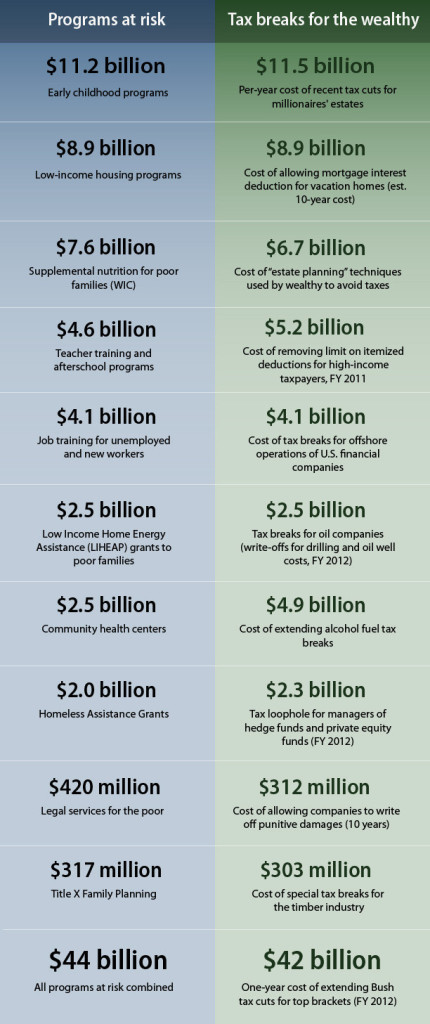
“This chart puts the class war in simple, visual terms. On the left you have the ‘shared sacrifices’ and ‘painful cuts’ that the Republicans claim we must make to get our fiscal house in order. On the right, you can plainly see WHY these cuts are ‘necessary.’” Via JackDean and several other sites, This is What Class War Looks Like.
But, hey, Win the Future and all that.